It is simple enough to add a chart or table that is created in Word or Excel into your blog post. In the application, simply control+click on the object. Once the object (chart or table) is complete then save it as a .jpg.
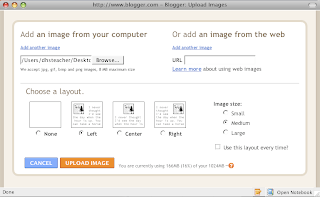
In blogger, place your cursor where you would like the image to appear. Click on the image icon from the HTML editor at the top of your posting text box. When the new window appears, select your image, select where in the post you want the image to appear (Left, Center, Right), and select the size of the image (Small, Medium, Large). Then click the upload button. The HTML code will appear in your textbox. Uploading your image should probably be done at the end of the post.